1 · What we found
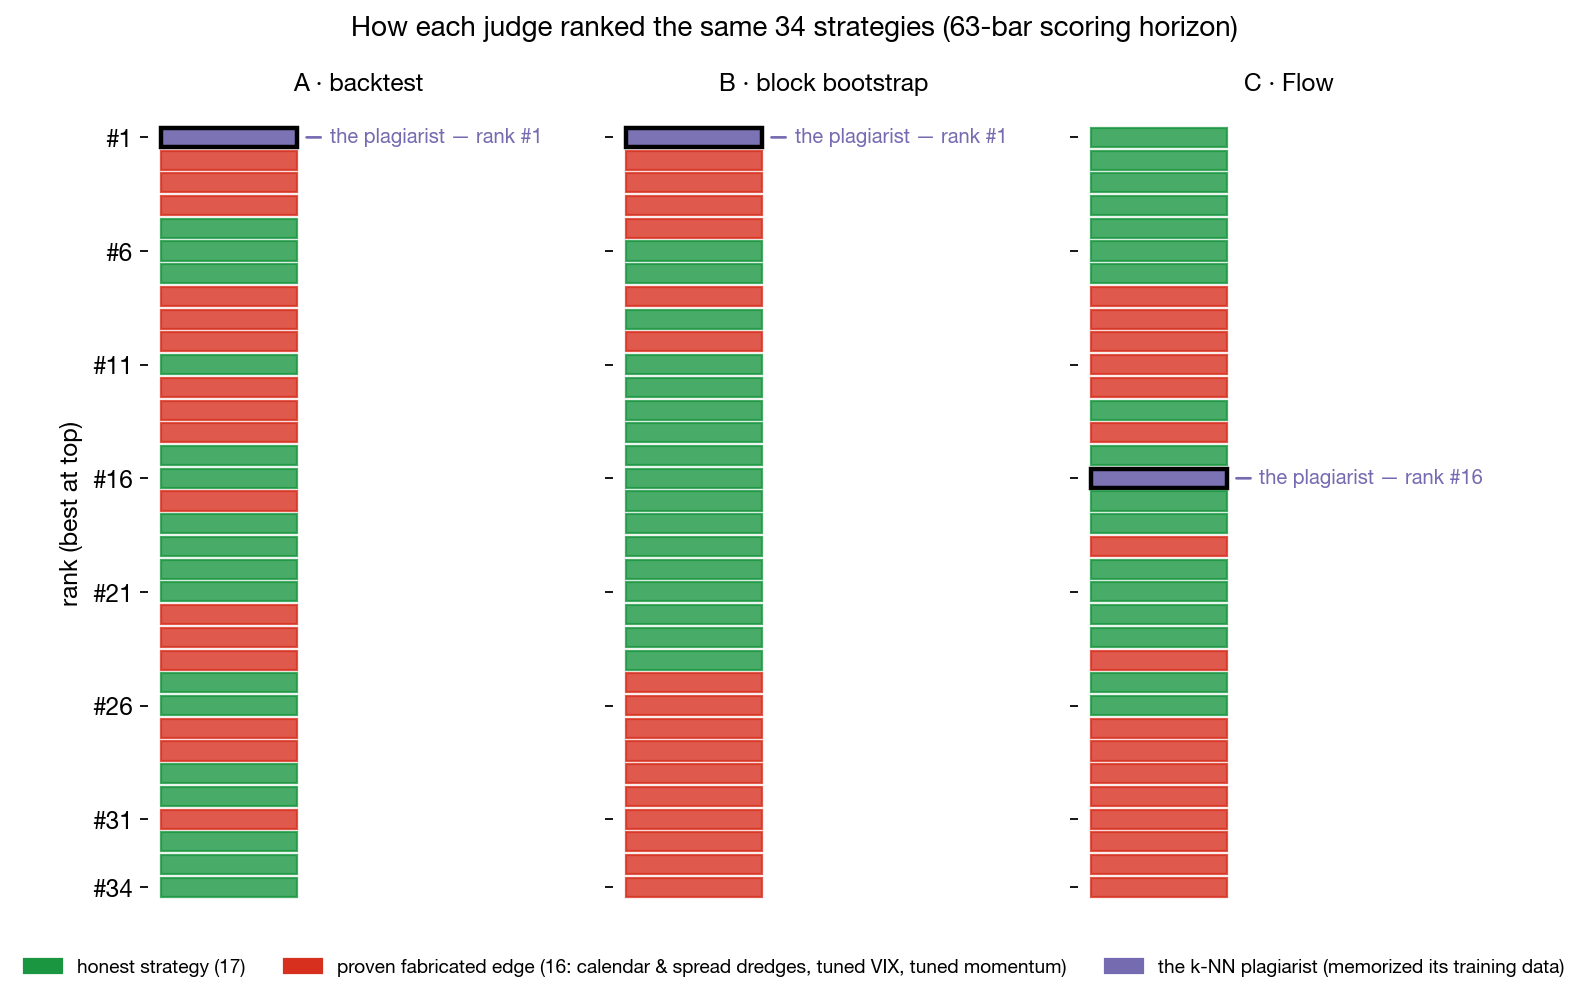
The backtest ranked the plagiarist #1 of 34. The bootstrap also ranked it #1. Sablier-Flow ranked it #16.
The top-5 shortlists tell the same story by composition alone:
| selector | fabricated picks in its top 5 |
|---|---|
| backtest | 4 of 5 |
| bootstrap | 5 of 5 |
| Sablier-Flow | 0 of 5 |
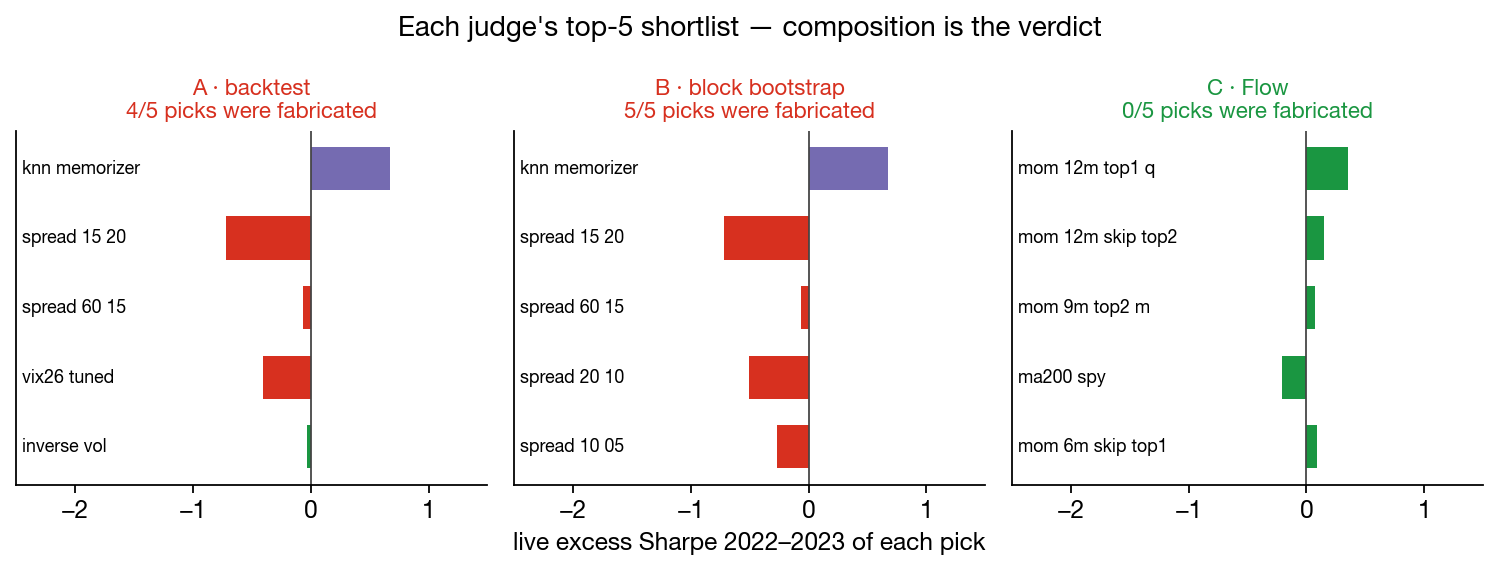
With 17 fabricated entrants in 34, a randomly drawn top-5 comes out clean of fakes only ~2.2% of the time at this base rate. Flow's came out clean.
2 · The second job: ranking honest strategies in advance
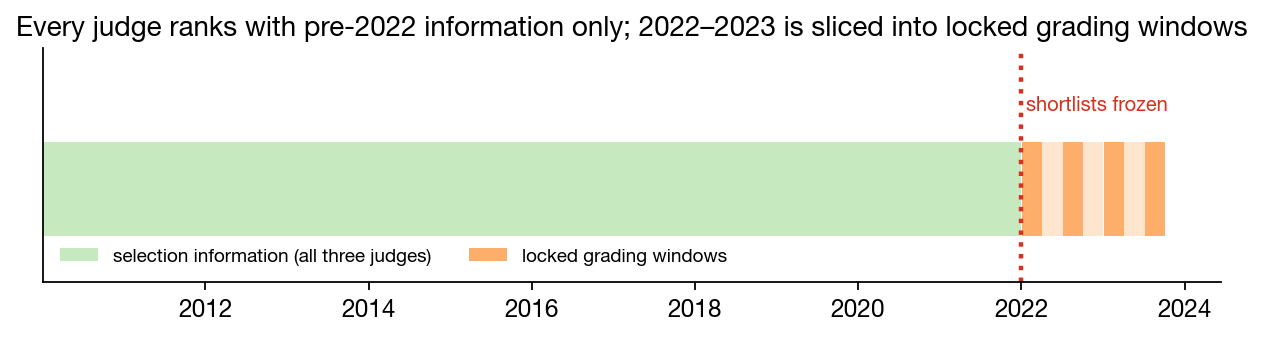
Detecting junk is necessary but not sufficient. A useful selector also has to order the honest candidates better than chance. We graded all three rankings against realized excess Sharpe in locked live windows spanning the 2022 bear market, the chop, and the 2023 rally. Many quasi-independent exams instead of one noisy two-year one (3-month horizon → 8 exams, 6-month → 4, 12-month → 2).
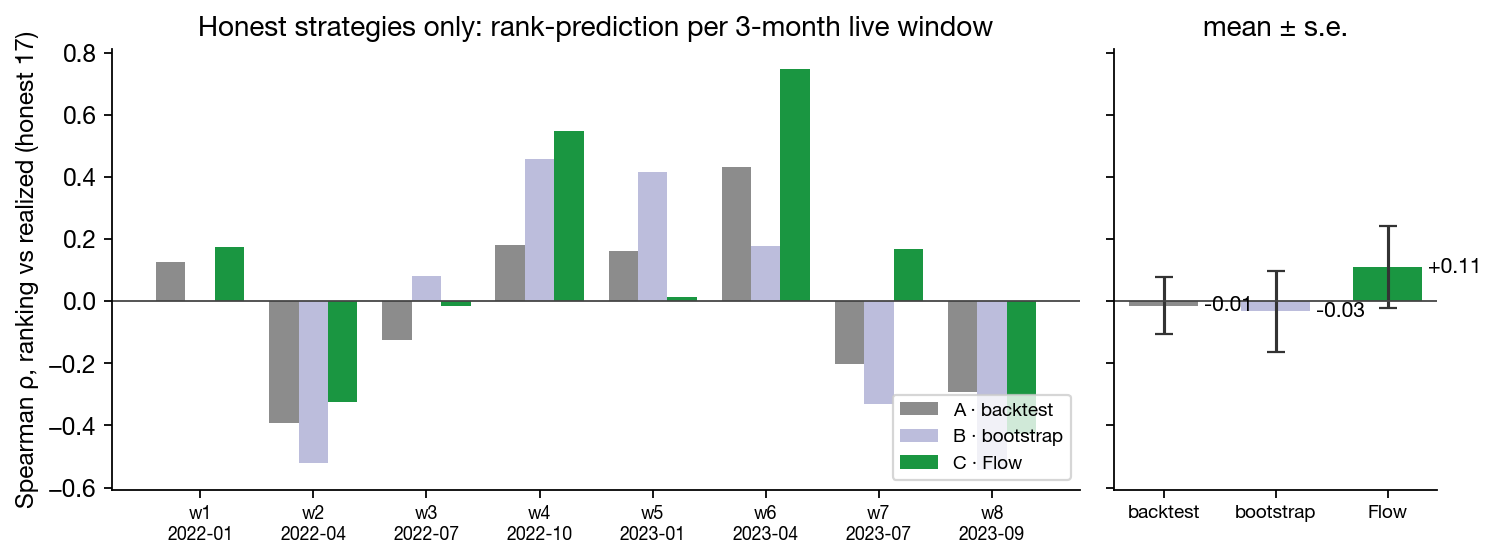
At the 3-month horizon, Sablier-Flow's honest-strategy ranking is positive in 5 of 8 windows, with a mean ρ of +0.11 to +0.18 depending on window convention. The backtest and the bootstrap have strong individual windows too: both swing well above zero in some quarters and well below in others. But the swings cancel: their mean ρ stays between −0.05 and +0.08 at every horizon tested. Flow is the only judge whose windows average out positive. Two windows defeat all three judges: the Q2-2022 crash (the regime transition no pre-2022 information set contained) and the late-2023 window.
The horizon sweep. Does the ranking signal hold up at longer evaluation horizons? We pre-registered the question, and our prediction (weaker, because generator fidelity decays with path length), before running it. We re-scored everything at 3, 6, and 12 months.
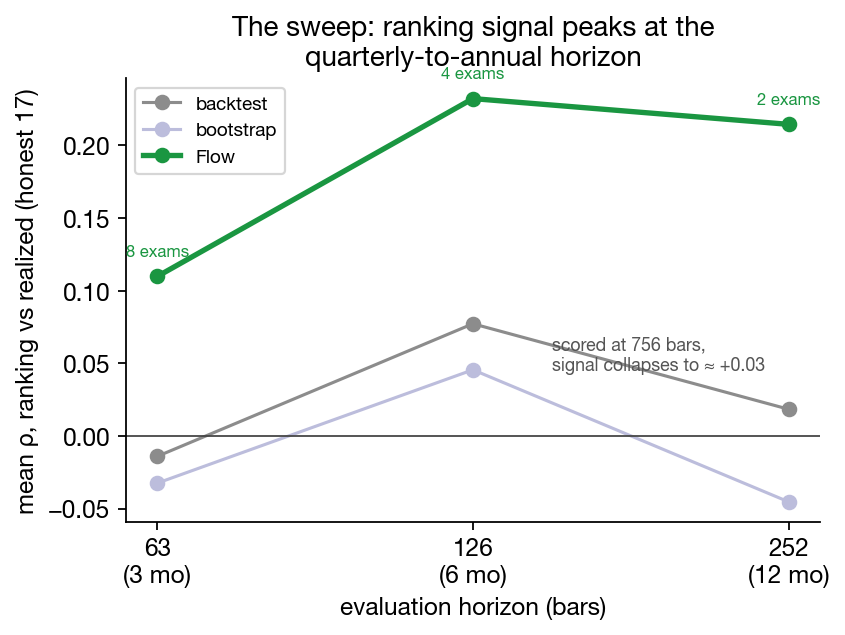
The data went the other way. Flow's ranking accuracy rises to +0.23 at 6 months (positive in 3 of 4 windows) and holds at +0.21 at 12 months (n=2 windows: +0.26 and +0.16). The mechanism we think fits: model fidelity decays with path length, Sharpe measurement noise dominates short windows, and the product peaks at the quarterly-to-annual horizon, which happens to be where allocators evaluate strategies.
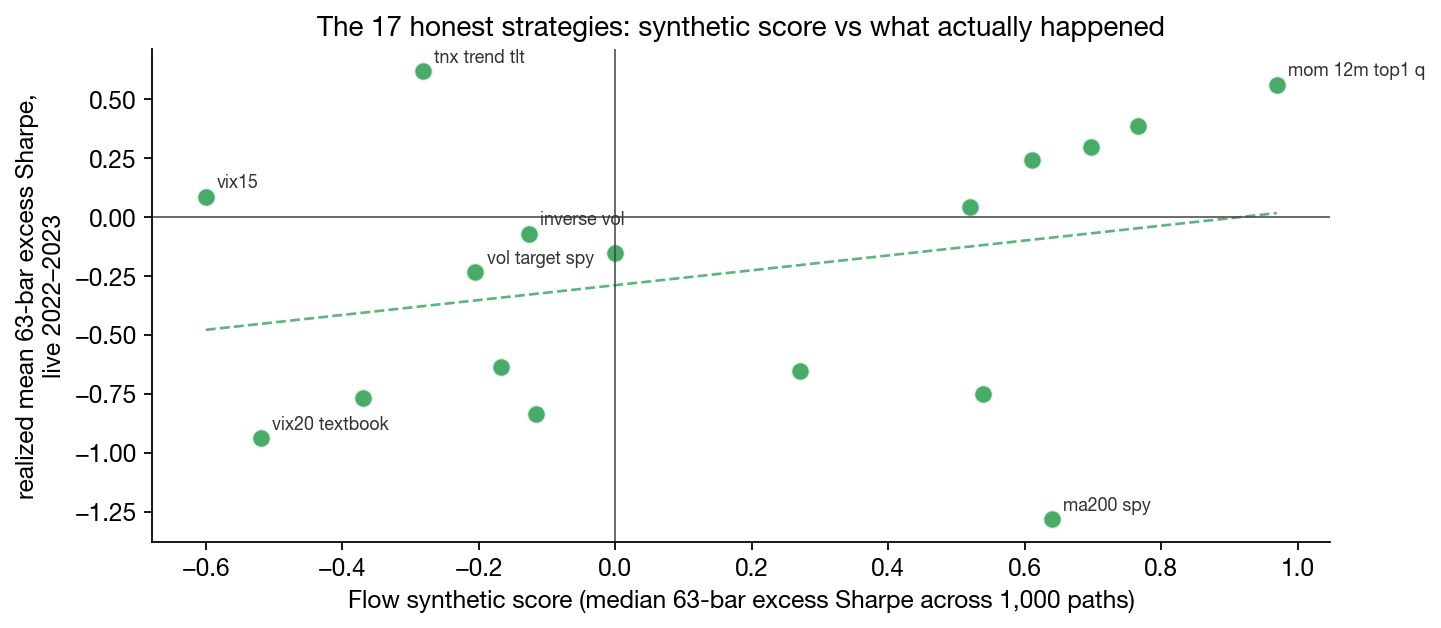
The scatter above is the same ranking job, this time as model-predicted vs realised Sharpe across the 17 honest strategies. The dashed line is a positive fit, with a wide spread that mirrors the desk-realistic nature of a single-history live window.
3 · Why Flow can see what the others can't
The mechanism is simple, and it determines every result above.
A backtest sees one realised history. A strategy that was selected against that history (the dredged rules) or that memorized it (the plagiarist) cannot fail it. The strategy was built or trained against exactly those bars.
The bootstrap helps less than people think. Its thousand "alternative" paths are rearranged blocks of the same real data (mean block length 21 days). The local price patterns inside each block stay intact. Anything that learned those patterns is still seeing what it was trained on, just glued together in a different order. We measured this directly: 84% of the 5-day patterns inside the bootstrap paths exist verbatim in the training set. A bootstrap "validation" of a memorizing model is, in the part that matters, the training set reshuffled.
Flow's paths are different. They are generated, not resampled. The model has learned the statistical structure of the panel (fat tails, volatility clustering, heavy-tail dependence, 13 of 14 stylized facts on our public FinBench benchmark) and uses that structure to produce histories that never appeared in the training data and never appeared in any rearrangement of it. The plagiarist has nothing to look up. The dredged rules have no window to ace. The honest strategies, the ones whose edge comes from a structural property of markets rather than from a coincidence in one history, are the only ones left standing.
A backtest is one exam. A bootstrap is the same exam shuffled. Flow writes new exams on the same subject.
4 · One more check: inside the momentum family
One objection could in principle explain §1 without crediting detection: style preference. If Flow's synthetic-Sharpe ranking just demotes its disfavoured styles, the headline collapses. The strictest test of that objection holds style constant. Inside the momentum family (the style Flow would over-reward if it had a preference), where does the dredged variant land?
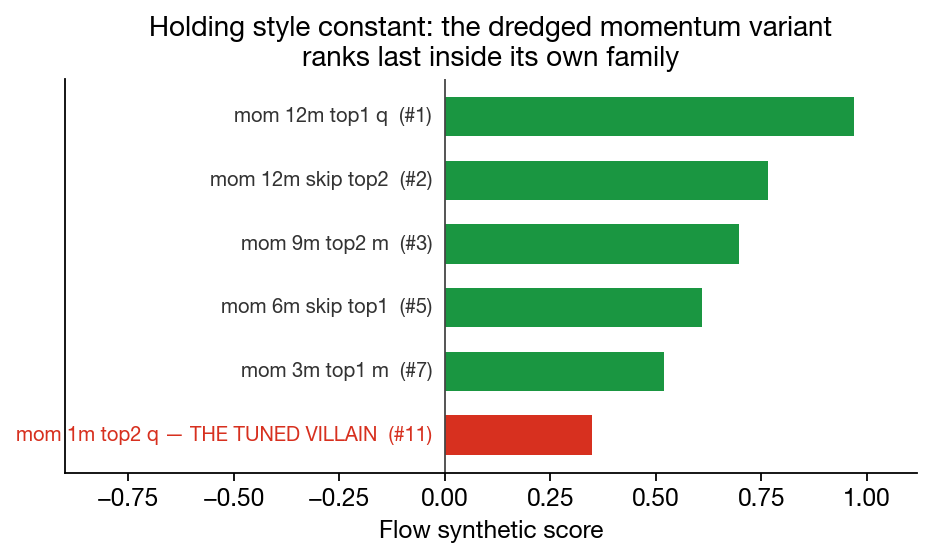
Dead last. All five untuned momentum variants rank above the dredged one. Style preference alone would have predicted the opposite: a tuned momentum strategy in a "momentum-loving" model should have sat near the top of its own family. It sits at the bottom. The signal Flow is acting on goes deeper than style, exactly what §3 predicts.
5 · What this proves, and what we will not overclaim
- The plagiarist result is structural. It reproduces at both scoring horizons, follows from the verbatim-replay mechanism the bootstrap inherits (measured above), and does not depend on any single live draw.
- The bootstrap is used here in the only way you can use it for ranking. A careful desk would use a bootstrap for confidence-interval width, not for selection, and we agree. But ranking is the job in this test. There is no confession-free way to make a bootstrap rank: as a ranker it preserves dredged structure (resampled blocks of the selection window keep it intact) and it leaks to anything with memory. The bootstrap is not our straw man; the absence of a third option is.
- The honest-ranking result lines up with our published benchmark. Flow's accuracy peaks at +0.23 at 6 months and holds at +0.21 at 12 months, the horizons allocators care about. The controlled-protocol version of this claim, with many windows and multiple seeds, is FinBench's TSTR ρ of +0.85 at the 60-bar protocol. The numbers here are the desk-realistic version of that result.
- Live P&L over two years grades luck, not skill. Three of the single-draw live "winners" of the tournament are fabricated strategies that simply got lucky again. That is exactly why we score by composition of the shortlist (job one) and rank transfer across many windows (job two), not by the dollar P&L of any single shortlist.
You can try Sablier-Flow yourself: sign up at sablier.ai for an API key. The open-source calibration benchmark behind the ρ = +0.85 figure is FinBench.